Although people-growing is probably a long way off, mice can now mostly develop inside an artificial uterus (try private window if you hit a paywall) thanks to a breakthrough in developmental biology. So far, the mice can only be kept alive halfway through gestation. There’s a point at which the nutrient formula provided to them isn’t enough, and they need a blood supply to continue growing. That’s the next goal. For now, let’s talk about that mechanical womb setup.
Carousel of Care
The mechanical womb was developed to better understand how various factors such as gene mutations, nutrients, and environmental conditions affect murine fetuses in development. Why do miscarriages occur, and why do fertilized eggs fail to implant in the first place? How exactly does an egg explode into 40 trillion cells when things do work out? This see-through uterus ought to reveal a few more of nature’s gestational secrets.
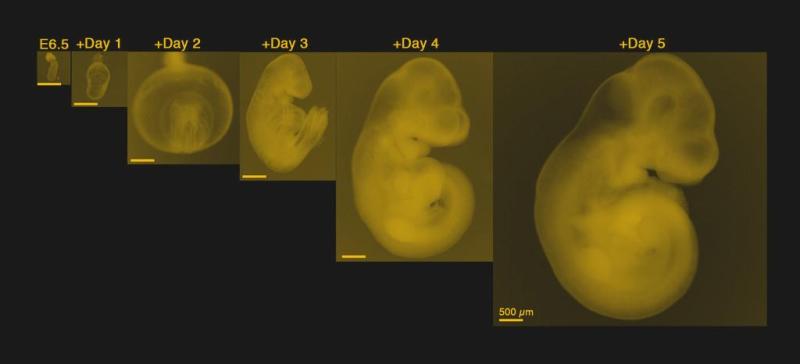
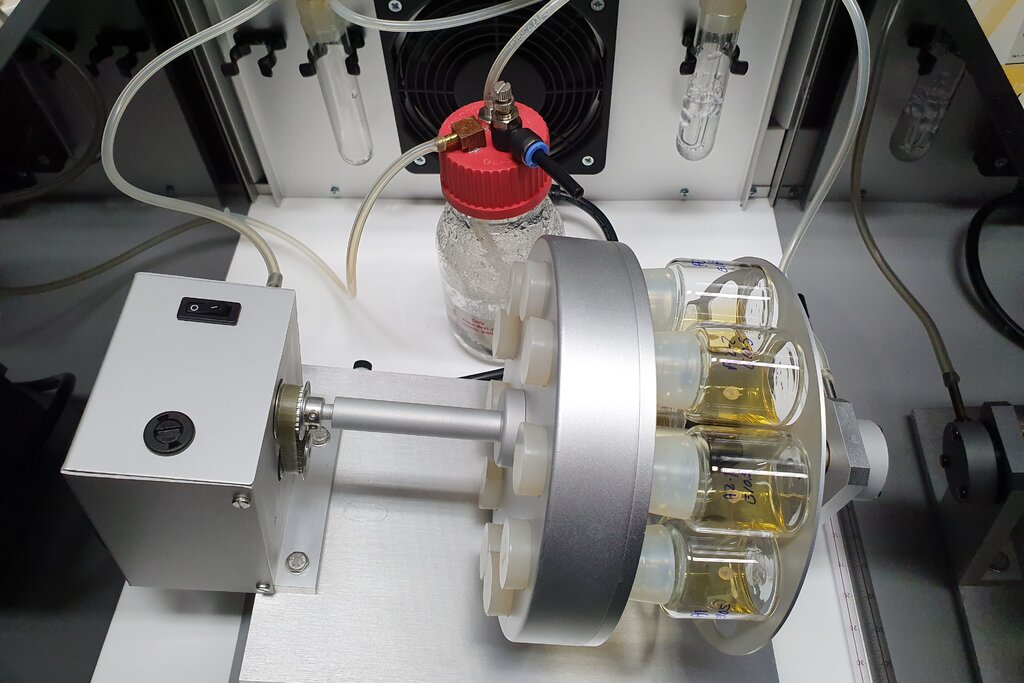
Dr. Jacob Hanna of Israel’s Weizmann Institute spent seven years building the two-part system of incubators, nutrients, and ventilation. Each mouse embryo floats in a glass jar, suspended in a concoction of liquid nutrients. A carousel of jars slowly spins around night and day to keep the embryos from attaching to the sides of the jars and dying. Along with the nutrient fluid, the mice receive a carefully-controlled mixture of oxygen and carbon dioxide from the ventilation machine. Dr. Hanna and his team have grown over 1,000 embryos this way.
Full gestation in mice takes about 20 days. As outlined in the paper published in Nature, Dr. Hanna and team removed mouse embryos at day five of gestation and were able to grow them for six more days in the artificial wombs. When compared with uterus-grown mice on day eleven, their sizes and weights were identical. According to an interview after the paper was published, the team have already gone even further, removing embryos right after fertilization on day zero, and growing them for eleven days inside the mechanical womb. The next step is figuring out how to provide an artificial blood supply, or a more advanced system of nutrients that will let the embryos grow until they become mice.
Embryonic Ethics
Here’s the most interesting part: the team doesn’t necessarily have to disrupt live gestation to get their embryos. New techniques allow embryos to be created from murine connective tissue cells called fibroblasts without needing fertilized eggs. Between this development and Dr. Hanna’s carousel of care, there would no longer be a need to fertilize eggs merely to destroy them later.
It’s easy to say that any and all animal testing is unethical because we can’t exactly get their consent (not that we would necessarily ask for it). At the same time, it’s true that we learn a lot from testing on animals first. Our lust for improved survival is at odds with our general empathy, and survival tends to win out on a long enough timeline. A bunch of people die every year waiting for organ transplants, and scientists are already growing pigs for that express purpose. And unlocking more mysteries of the gestation process make make surrogate pregnancies possible for more animals in the frozen zoo.
In slightly more unnerving news, some have recently created embryos that are part human and part monkey for the same reason. Maybe this is how we get to planet of the apes.
Researchers from University of Arizona and University of Utah published a new paper in the Journal of Marketing that examines why most scholarly research is misinterpreted by the public or never escapes the ivory tower and suggests that such research gets lost in abstract, technical, and passive prose.
The study, forthcoming in the Journal of Marketing, is titled “Marketing Ideas: How to Write Research Articles that Readers Understand and Cite” and is authored by Nooshin L. Warren, Matthew Farmer, Tiany Gu, and Caleb Warren.
From developing vaccines to nudging people to eat less, scholars conduct research that could change the world, but most of their ideas either are misinterpreted by the public or never escape the ivory tower.
Why does most academic research fail to make an impact? The reason is that many ideas in scholarly research get lost in an attic of abstract, technical, and passive prose. Instead of describing “spilled coffee” and “one-star Yelp reviews,” scholars discuss “expectation-disconfirmation” and “post-purchase behavior.” Instead of writing “policies that let firms do what they want have increased the gap between the rich and the poor,” scholars write sentences like, “The rationalization of free-market capitalism has been resultant in the exacerbation of inequality.” Instead of stating, “We studied how liberal and conservative consumers respond when brands post polarizing messages on social media,” they write, “The interactive effects of ideological orientation and corporate sociopolitical activism on owned media engagement were studied.”
Why is writing like this unclear? Because it is too abstract, technical, and passive. Scholars need abstraction to describe theory. Thus, they write about “sociopolitical activism” rather than Starbucks posting a “Black Lives Matter” meme on Facebook. They are familiar with technical terms, such as “ideological orientation,” and they rely on them rather than using more colloquial terms such as “liberal or conservative.” Scholars also want to sound objective, which lulls them into the passive voice (e.g., the effects… were studied) rather than active writing (e.g., “we studied the effects…”). Scholars need to use some abstract, technical, and passive writing. The problem is that they tend to overuse these practices without realizing it.
When writing is abstract, technical, and passive, readers struggle to understand it. In one of the researchers’ experiments, they asked 255 marketing professors to read the first page of research papers published in the Journal of Marketing (JM), Journal of MarketingResearch (JMR), and Journal of Consumer Research (JCR). The professors understood less of the papers that used more abstract, technical, and passive writing compared to those that relied on concrete, non-technical, and active writing.
As Warren explains, “When readers do not understand an article, they are unlikely to read it, much less absorb it and be influenced by its ideas. We saw this when we analyzed the text of 1640 articles published in JM, JMR, and JCR between 2000 and 2010. We discovered that articles that relied more on abstract, technical, and passive writing accumulated fewer citations on both Google Scholar and the Web of Science.” An otherwise average JM article that scored one standard deviation lower (clearer) on our measures of abstract, technical, and passive writing accumulated approximately 157 more Google Scholar citations as of May 2020 than a JM article with average writing.
Why do scholars write unclearly? There is an unlikely culprit: knowledge. Conducting good research requires authors to know a lot about their work. It takes years to create research that meaningfully advances scientific knowledge. Consequently, academic articles are written by authors who are intimately familiar with their topics, methods, and results. Authors, however, often forget or simply do not realize that potential readers (e.g., Ph.D. students, scholars in other sub-disciplines, practicing professionals, etc.) are less familiar with the intricacies of the research, a phenomenon called the curse of knowledge.
The research team explores whether the curse of knowledge might be enabling unclear writing by asking Ph.D. students to write about two research projects. The students wrote about one project on which they were the lead researcher and another project led by one of their colleagues. The students reported that they were more familiar with their own research than their colleague’s research. They also thought that they wrote more clearly about their own research, but they were mistaken. In fact, the students used more abstraction, technical language, and passive voice when they wrote about their own research than when they wrote about their colleague’s research.
“To make a greater impact, scholars need to overcome the curse of knowledge so they can package their ideas with concrete, technical, and active writing. Clear writing gives ideas the wings needed to escape the attics, towers, and increasingly narrow halls of their academic niches so that they can reduce infection, curb obesity, or otherwise make the world a better place,” says Farmer.
The Florida Keys Mosquito Control District and Oxitec Ltd today announced location participation plans for its landmark Florida Keys pilot project. Project managers anticipate that during the last week of April and first week of May release boxes, non-release boxes and netted quality control boxes will be placed in six locations: two on Cudjoe Key, one on Ramrod Key and three on Vaca Key. Throughout all release locations less than 12,000 mosquitoes are expected to emerge each week for approximately 12 weeks. Untreated comparison sites will be monitored with mosquito traps on Key Colony Beach, Little Torch Key, and Summerland Key.
This marks the start of the US EPA approved project to evaluate this safe, sustainable and environmentally-friendly solution to control the invasive Aedes aegypti mosquito species.
Oxitec’s non-biting male mosquitoes will emerge from the boxes to mate with the local biting female mosquitoes. The female offspring of these encounters cannot survive, and the population of Aedes aegypti is subsequently controlled.
The Aedes aegypti mosquito makes up about four percent of the mosquito population in the Keys but is responsible for virtually all mosquito-borne diseases transmitted to humans. This species of mosquito transmits dengue, Zika, yellow fever and other human diseases, and can transmit heartworm and other potentially deadly diseases to pets and animals.
There’s a lot of fear mongering on this one, based on some outright lies and old facts, eg using an old nature article that has since been rescinded, inflating massively the number of mosquitos to be released, saying people aren’t told where the mosquitos will be released (they do tell people, just read above), etc etc. I’m sure that maybe some of their fears are legitimate but throwing in all of this bullshit really weakens their case and makes me too bored to find the hidden gem in the codswallop after I keep factchecking and finding out that the fearmongers are lying yet again.
Glaciers are melting faster, losing 31 percent more snow and ice per year than they did 15 years earlier, according to three-dimensional satellite measurements of all the world’s mountain glaciers.
[…]
Using 20 years of recently declassified satellite data, scientists calculated that the world’s 220,000 mountain glaciers are losing more than 328 billion tons (298 billion metric tons) of ice and snow per year since 2015, according to a study in Wednesday’s journal Nature. That’s enough melt flowing into the world’s rising oceans to put Switzerland under almost 24 feet (7.2 meters) of water each year.
The annual melt rate from 2015 to 2019 is 78 billion more tons (71 billion metric tons) a year than it was from 2000 to 2004. Global thinning rates, different than volume of water lost, doubled in the last 20 years
[…]
Almost all the world’s glaciers are melting, even ones in Tibet that used to be stable, the study found. Except for a few in Iceland and Scandinavia that are fed by increased precipitation, the melt rates are accelerating around the world.
On April 20, the MOXIE device on Perseverance produced roughly 5 grams of oxygen. That’s a tiny step for NASA and its rover, but a potentially huge leap for humanity and our aspirations on Mars. This small amount of oxygen—extracted from the carbon dioxide-rich Martian atmosphere—is only enough to sustain an astronaut for about five minutes, but it’s the principle of the experiment that matters. This technology demonstration shows that it’s possible to produce oxygen on Mars, a necessary requirement for sustainably working on and departing the Red Planet.
[…]
“Someday we hope to send people to Mars, but they will have to take an awful lot of stuff with them,” Michael Hecht, the principal investigator of the MOXIE project, explained in an email. “The single biggest thing will be a huge tank of oxygen, about 25 tonnes of it.”
Yikes—that converts to approximately 55,100 pounds, or 25,000 kg.
Some of this oxygen will be for the astronauts to breathe, but the “bulk of it” will be used for the rocket “to take the crew off the planet and start them on their journey home again,” Hecht said.
Hence the importance of the MOXIE experiment. Should we be capable of making that oxygen on Mars, it would “save a lot of money, time, and complexity,” said Hecht, but it’s a “challenging new technology that we can only really test properly if we actually do it on Mars,” and that’s “what MOXIE is for, even though it’s a very small scale model.”
[…]
MOXIE works by separating oxygen from carbon dioxide, leaving carbon monoxide as the waste product.
“MOXIE uses electrical energy to take carbon dioxide molecules, CO2, and separate them into two other types of molecule, carbon monoxide (CO) and oxygen (O2),” Hecht explained. “It uses a technology called electrolysis that is very similar to a fuel cell, except that a fuel cell goes the other way—it starts with fuel and oxygen and combines them to get electrical energy out.”
[…]
When asked what surprised him most about the first test, Hecht said it was the identical performance compared to tests done on Earth.
Google Earth has partnered with NASA, the U.S. Geological Survey, the EU’s Copernicus Climate Change Service, and Carnegie Mellon University’s CREATE Lab to bring users time-lapse images of the planet’s surface—24 million satellite photos taken over 37 years. Together they offer photographic evidence of a planet changing faster than at any time in millennia. Shorelines creep in. Cities blossom. Trees fall. Water reservoirs shrink. Glaciers melt and fracture.
“We can objectively see global warming with our own eyes,” said Rebecca Moore, director of Google Earth. “We hope that this can ground everyone in an objective, common understanding of what’s actually happening on the planet, and inspire action.”
Timelapse, the name of the new Google Earth feature, is the largest video on the planet, according to a statement from the company, requiring 2 million hours to process in cloud computers, and the equivalent of 530,000 high-resolution videos. The tool stitches together nearly 50 years of imagery from the U.S.’s Landsat program, which is run by NASA and the USGS. When combined with images from complementary European Sentinel-2 satellites, Landsat provides the equivalent of complete coverage of the Earth’s surface every two days. Google Earth is expected to update Timelapse about once a year.
The Timelapse images are stark. In Southwestern Greenland, warmer Atlantic waters and air temperatures are accelerating ice melt.
Claushavn, Greenland
Source: Google
Tree loss in Brazil in 2020 surged by a quarter over the prior year.
Longyangxia Solar Park, located in Gonghe County, Qinghai Province.
Source: Google
This image, below, illustrates what it took to make a viewable experience. The 24 million images had to be processed to remove clouds or other obstructions and then stitched together into the final product.
Twenty-four million satellite images from 1984 to 2020 were analyzed to identify and remove artifacts, like clouds.
Source: Google
“Now, our one, static snapshot of the planet”—Google Earth—“has become dynamic, providing ongoing visual evidence of Earth’s changes from climate and human behavior occurring across space and time, over four decades,” Moore said. “And this was made possible because of the U.S. government and European Union’s commitments to open and accessible data.”
A new experimental treatment could someday give people a way to grow missing teeth, if early research on lab animals holds up.
Scientists at Japan’s Kyoto University and the University of Fukui developed a monoclonal antibody treatment that seems to trigger the body to grow new teeth, according to research published last month in the journal Science Advances. If upcoming experiments continue to work, it could eventually give us a way to regrow teeth lost in adulthood or those that were missing since childhood due to congenital conditions.
[…]
eventually the team found that blocking a gene called USAG-1 led to increased activity of Bone Morphogenic Protein (BMP), a molecule that determines how many teeth will grow in the first place, and allowed adult mice to regrow any that they were missing.
The experiment also worked on ferrets, which the researchers say is important because their teeth are far more humanlike than mouse teeth are.
“Ferrets are diphyodont animals with similar dental patterns to humans,” Kyoto researcher and lead study author Katsu Takahashi said in the press release. “Our next plan is to test the antibodies on other animals such as pigs and dogs.”
There’s still a long way to go before they reach human trials, but continued success in those upcoming trials would be a promising sign for the future of a clinical treatment that lets us naturally regrow our missing teeth.
Here we show that individuals who are asleep and in the midst of a lucid dream (aware of the fact that they are currently dreaming) can perceive questions from an experimenter and provide answers using electrophysiological signals. We implemented our procedures for two-way communication during polysomnographically verified rapid-eye-movement (REM) sleep in 36 individuals. Some had minimal prior experience with lucid dreaming, others were frequent lucid dreamers, and one was a patient with narcolepsy who had frequent lucid dreams. During REM sleep, these individuals exhibited various capabilities, including performing veridical perceptual analysis of novel information, maintaining information in working memory, computing simple answers, and expressing volitional replies. Their responses included distinctive eye movements and selective facial muscle contractions, constituting correctly answered questions on 29 occasions across 6 of the individuals tested. These repeated observations of interactive dreaming, documented by four independent laboratory groups, demonstrate that phenomenological and cognitive characteristics of dreaming can be interrogated in real time.
The production of glass—one of humanity’s oldest materials—is getting a 21st century makeover. A new approach to glassmaking treats the material like plastic, allowing scientists to injection mold vaccine vials, sinuous channels for carrying out lab chemistry, and other complex shapes.
“It’s a really exciting paper,” says André Studart, a materials scientist at ETH Zürich. “This is a great way to form glass into complicated and interesting geometries.”
[…]
In 2017, researchers led by Frederik Kotz, a microsystems engineer at the Albert Ludwig University of Freiburg, set out to change that. They reworked a 3D printer to forge glass rather than printing plastics or metals.
The scientists created a printable powder by mixing silica nanoparticles with a polymer that could be cured with ultraviolet (UV) light. After printing the shapes they wanted, they cured the polymer with UV light so it would hold its shape. They then fired the mix in an oven to burn off the polymer and fuse the silica particles into a continuous glass structure.
The approach worked, making it possible to craft shapes such as tiny pretzels and replica castle gates. The work garnered interest from companies wanting to build minute lenses and other complex transparent optical components for telecommunications equipment. But the procedure was slow, turning out components one by one, rather than a fully industrial approach that could produce parts en masse, as is done with plastic.
To speed things up, Kotz and his colleagues have now extended their nanocomposite approach to work with injection molding, a process used to mass produce plastic parts like toys and car bumpers by the ton. The researchers again started with tiny silica particles. The team then mixed the silica with two polymers, polyethylene glycol (PEG) and polyvinyl butyral (PVB). The mixture created a dry powder with the consistency of toothpaste. The team fed the paste into an extruder that pressed it into a preformed mold with shapes such as a disc or tiny gear.
Outside of the mold, the parts hold their shape because myriad weak attractive bonds, called van der Waals interactions, form between neighboring silica particles. But the parts are still fragile.
To harden them, the researchers used water to wash away the PEG. They then fired the remaining material in two stages: First at 600°C to burn out the PVB, and second at 1300°C to fuse the silica particles into the final piece.
“What you get in the end is high purity silica glass” in any shape you want, Kotz says. The glass parts also end up with the optical and chemical characteristics needed for commercial telecommunications devices and chemical reactors, he and his colleagues report today in Science.
[…]
However, Studart says this new approach to mass producing glass parts still faces a bottleneck: Washing away the PEG must be done slowly, over days, to ensure the glass parts don’t crack. Speed that up, he says, and injection molding of glass could become as popular as it is with plastic.
a group of mavericks out of Switzerland have detected a magnetic signal in a plant. Using a highly sensitive magnetometer, an interdisciplinary team of researchers have measured signals from a Venus flytrap of up to .5 picotesla. To make matters even more mind-blowing, this signal is roughly equivalent to the biomagnetic field strength of the human brain. The full report is here.
The findings shine a light on a whole new world of plant communications we never knew was there and paves the path for new approaches to diagnose and treat plant diseases. It’s a parade-worthy “I told you so” for champions of plant intelligence, and a new dawn for how we live in harmony with the green kingdom.
[…]
So, why does it matter that a plant has a detectable biomagnetic signal? Well, bioelectromagnetism is the amount of magnetic signal given off by a living thing,
[…]
The Venus flytrap boasts three trigger hairs that serve as mechanosensors. When a prey insect touches a trigger hair, an Action Potential is generated and travels along both trap lobes. If a second touch-induced Action Potential is fired within 30 seconds, the energy stored in the open trap is released and the capture organ closes. This is the plant-insect equivalent of a repeat offender. Imprisonment ensues.
Crucial to making these findings was the fact that this electrical activity doesn’t carry into the stalk of traps, which allowed the researchers to isolate the lobe by slicing it from the rest of the plant. Biologically intact, it was then placed on to a sensor.
[…]
The readings returned pretty much identical results four times in a row.
The discovery is as huge for biomagnetism in plants as it is for electro-physiology in general. We now have proof of a pathway for long-distance signal propagation between plant cells. Talk amongst your cells.
Both signal a new era of understanding plant systems we are only just coming to grips with.
A 2017 study published in ‘Frontiers in Plant Science’ looked at the photosynthetic properties of pale green leaf rice. Image: Gu, et. al.
Now what?
The report’s introduction ponders, “in the future, magnetometry may be used to study long-distance electrical signaling in a variety of plant species, and to develop noninvasive diagnostics of plant stress and disease.”
With the help of this current research, crops could be scanned for temperature shifts, chemical changes, or pests without having to damage the plants themselves.
[…]
Perhaps our best next step is looking at how other species interact with these magnetic fields. Since these fields exist, they may serve some practical purpose. “Plants and insects have co-evolved for millions of years,” explained Crutsinger. “The trap is getting prey. But insects could leverage that to their own benefit as well. They’re super sensitive and they have antennas. How might they cue in on the magn
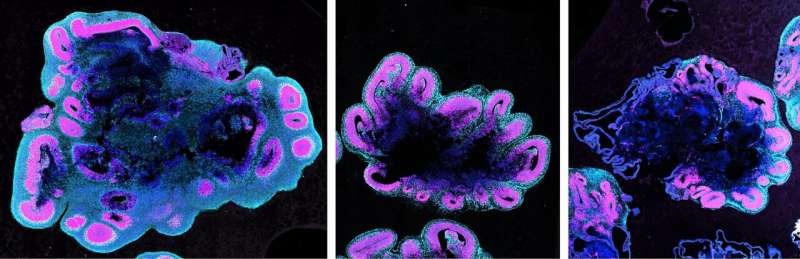
The study, published in the journal Cell, compared ‘brain organoids’ – 3-D tissues grown from stem cells which model early brain development—that were grown from human, gorilla and chimpanzee stem cells.
Similar to actual brains, the human brain organoids grew a lot larger than the organoids from other apes.
[…]
During the early stages of brain development, neurons are made by stem cells called neural progenitors. These progenitor cells initially have a cylindrical shape that makes it easy for them to split into identical daughter cells with the same shape.
The more times the neural progenitor cells multiply at this stage, the more neurons there will be later.
As the cells mature and slow their multiplication, they elongate, forming a shape like a stretched ice-cream cone.
Previously, research in mice had shown that their neural progenitor cells mature into a conical shape and slow their multiplication within hours.
Now, brain organoids have allowed researchers to uncover how this development happens in humans, gorillas and chimpanzees.
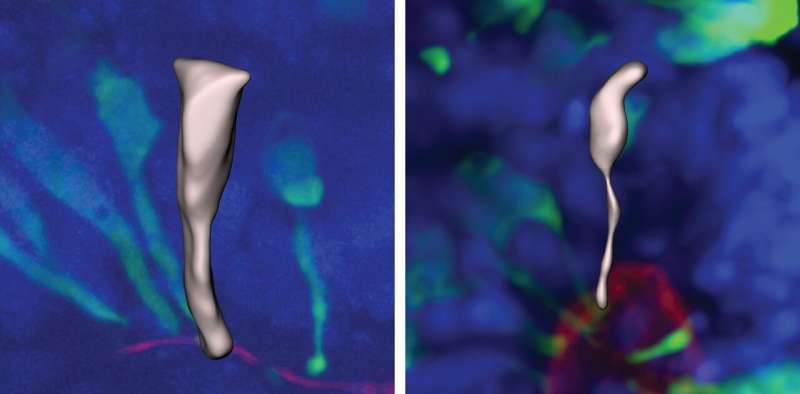
They found that in gorillas and chimpanzees this transition takes a long time, occurring over approximately five days.
After only 5 days, gorilla neural progenitor cells have matured into a conical shape (right), while human cells (left) remain cylindrical. Credit: S.Benito-Kwiecinski/MRC LMB/Cell
Human progenitors were even more delayed in this transition, taking around seven days. The human progenitor cells maintained their cylinder-like shape for longer than other apes and during this time they split more frequently, producing more cells.
This difference in the speed of transition from neural progenitors to neurons means that the human cells have more time to multiply. This could be largely responsible for the approximately three-fold greater number of neurons in human brains compared with gorilla or chimpanzee brains.
[…]
To uncover the genetic mechanism driving these differences, the researchers compared gene expression—which genes are turned on and off—in the human brain organoids versus the other apes.
They identified differences in a gene called ‘ZEB2’, which was turned on sooner in gorilla brain organoids than in the human organoids.
To test the effects of the gene in gorilla progenitor cells, they delayed the effects of ZEB2. This slowed the maturation of the progenitor cells, making the gorilla brain organoids develop more similarly to human—slower and larger.
Conversely, turning on the ZEB2 gene sooner in human progenitor cells promoted premature transition in human organoids, so that they developed more like ape organoids.
The researchers note that organoids are a model and, like all models, do not to fully replicate real brains, especially mature brain function. But for fundamental questions about our evolution, these brain tissues in a dish provide an unprecedented view into key stages of brain development that would be impossible to study otherwise.
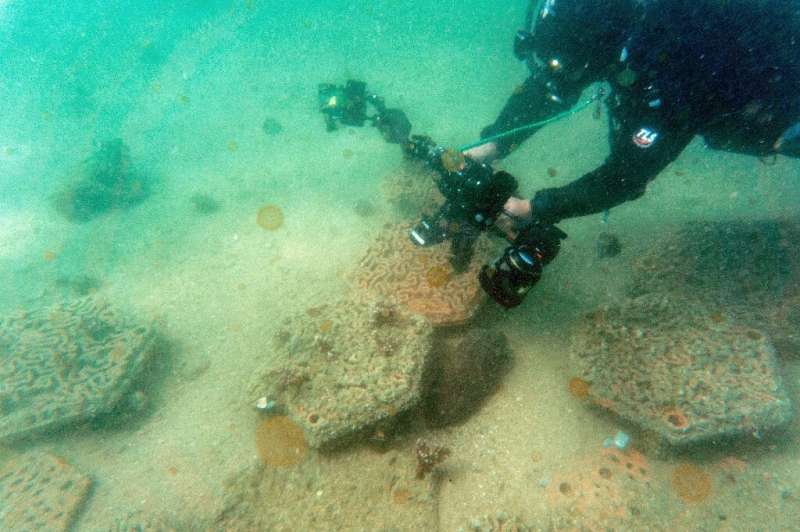
In jade waters off Hong Kong’s eastern shoreline, scientists are thrilled to spot a cuttlefish protecting her eggs inside an artificial, 3D-printed clay seabed helping to restore the city’s fragile coral reefs.
[…]
Around 84 species of coral are found in Hong Kong’s waters, scientists say, more diverse than those found in the Caribbean Sea.
Most can be found on remote inlets, far from the sediment-filled Pearl River Delta and its busy shipping channels.
[…]
They have begun using 3D printed tiles that work as an artificial bed for corals to latch onto and thrive, with promising results.
“The first time we put down the tiles, there were a few fish around,” she told AFP on a recent inspection by University of Hong Kong (HKU) researchers.
Now the artificially produced reef laid down last summer is teeming with wildlife, including the cuttlefish, something Yu described as “very, very exciting”.
[…]
Corals are colonies of billions of living polyp invertebrates and are hugely sensitive to temperature changes.
When they get too hot, they lose their vibrant colour and die.
Repopulating a dead or damaged reef requires suitable ground for the remaining coral larvae to latch onto and build a new home—and the printed tiles have so far proven dependable.
“3D printing allows us to customise a tile or a solution for any type of environment and I think that’s the real potential that the technology brings,” David Baker, an associate professor at HKU’s School of Biological Sciences who led development of the technology, told AFP.
Tiles carrying 400 coral fragments have been laid on a 40 square-metre (430 square-foot) section of sea floor in the marine park.
“The corals now on the tiles definitely survive better than the traditional way of transplantation,” said Yu, putting the success rate at around 90 percent.
Some projects around the world have deliberately sunk ships or concrete onto the sea floor to encourage coral growth. And while those methods have had some success, they can change the chemistry of the water.
The tiles used in the Hong Kong project are made with terracotta, minimising the environmental impact.
“Clay is basically soil, so soil you can find everywhere on earth,” said Christian Lange, an associate professor from HKU’s Department of Architecture.
It leaves water chemistry unchanged, Lange added, and if a tile fails to spawn a new colony it will simply erode without leaving a trace.
It’s been well established by now that the agricultural systems producing our food contribute at least one fifth of global anthropogenic carbon emissions—and up to a third if waste and transportation are factored in. A troubling new report points to a previously overlooked source: an industrial fishing process practiced by dozens of countries around the world, including the United States, China, and the E.U.
The study, published today in the scientific journal Nature, is the first to calculate the carbon cost of bottom trawling, in which fishing fleets drag immense weighted nets along the ocean floor, scraping up fish, shellfish and crustaceans along with significant portions of their habitats.
According to calculations conducted by the report’s 26 authors, bottom trawling is responsible for one gigaton of carbon emissions a year—a higher annual total than (pre-pandemic) aviation emissions. Not only does the practice contribute to climate change, it is extremely damaging to ocean biodiversity—the “equivalent of ploughing an old-growth forest into the ground, over and over and over again until there is nothing left” according to lead author Enric Sala, a marine biologist who is also National Geographic’s Explorer in Residence.
Bottom trawling is also one of the least cost effective methods of fishing. Most locations have been trawled so many times, there is little left worth catching, says Sala. “Without government subsidies, no one would be making a penny.” But Sala didn’t set out to condemn bottom trawlers when he designed the research project back in 2018. He was looking for the incentives that just might make the fishing industry, and governments, give up on the practice on their own. The carbon findings may just do the trick.
[…]
Refuting a long-held view that ocean protection harms fisheries, the study found that well placed marine protected areas (MPAs) that ban fishing would actually boost the production of marine life by functioning as fish nurseries and biodiversity generators capable of seeding stocks elsewhere. According to the study results, protecting the right places could increase the global seafood catch by over 8 million metric tons a year, despite the challenges of overfishing and climate change.
Bottom trawling, however, would have to stop, says Sala. While mangroves, kelp forests and sea grass meadows are good at capturing carbon, the bottom of the ocean, piled deep with marine animal debris, is a far greater carbon sink. But when the trawlers’ weighted nets scrape the sea floor that carbon is released back into the water. Excess carbon in water turns it acidic, which is damaging to sea life.
Worse still, the practice also impacts the ocean’s ability to absorb atmospheric carbon: if the water is already saturated from sources down below, it will be unable to absorb human-caused emissions from above, hamstringing one of our best assets in the fight against climate change. By combining publicly-available data on global bottom trawler activity with pixel-level assessments of carbon stored in the top layers of ocean sediments, Sala and his team were able to calculate the amount of emissions produced by the technique, down to the level of national fleets. The European Union, for example, releases 274,718,086 metric tons of marine sediment carbon into the ocean a year, while Chinese fleets release 769,294,185 metric tons, and the United States releases 19,373,438.
A bit of seaweed in cattle feed could reduce methane emissions from beef cattle as much as 82 percent, according to new findings from researchers at the University of California, Davis. The results, published today in the journal PLOS ONE, could pave the way for the sustainable production of livestock throughout the world.
“We now have sound evidence that seaweed in cattle diet is effective at reducing greenhouse gases and that the efficacy does not diminish over time,”
[…]
Over the course of five months last summer, Kebreab and Roque added scant amounts of seaweed to the diet of 21 beef cattle and tracked their weight gain and methane emissions. Cattle that consumed doses of about 80 grams (3 ounces) of seaweed gained as much weight as their herd mates while burping out 82 percent less methane into the atmosphere. Kebreab and Roque are building on their earlier work with dairy cattle, which was the world’s first experiment reported that used seaweed in cattle.
[…]
Results from a taste-test panel found no differences in the flavor of the beef from seaweed-fed steers compared with a control group. Similar tests with dairy cattle showed that seaweed had no impact on the taste of milk.
Also, scientists are studying ways to farm the type of seaweed—Asparagopsis taxiformis—that Kebreab’s team used in the tests. There is not enough of it in the wild for broad application.
Another challenge: How do ranchers provide seaweed supplements to grazing cattle on the open range? That’s the subject of Kebreab’s next study.
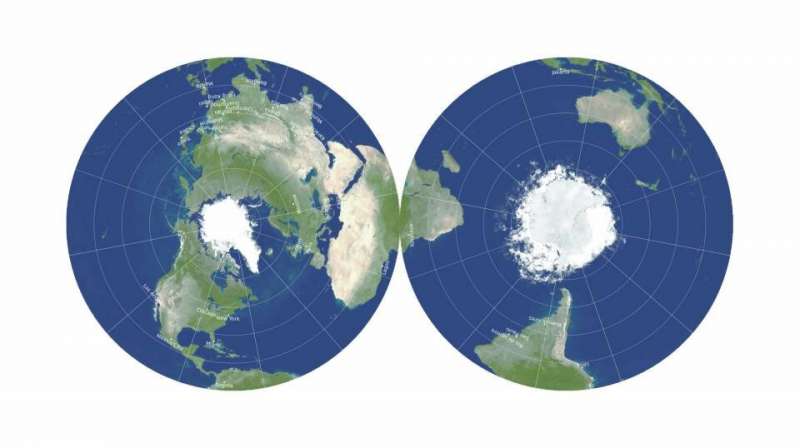
For centuries, mapmakers have agonized over how to accurately display our round planet on anything other than a globe.
Now, a fundamental re-imagining of how maps can work has resulted in the most accurate flat map ever made, from a trio of map experts: J. Richard Gott, an emeritus professor of astrophysics at Princeton and creator of a logarithmic map of the universe once described as “arguably the most mind-bending map to date”; Robert Vanderbei, a professor of operations research and financial engineering who created the “Purple America” map of election results; and David Goldberg, a professor of physics at Drexel University.
Their new map is two-sided and round, like a phonograph record or vinyl LP. Like many radical developments, it seems obvious in hindsight. Why not have a two-sided map that shows both sides of the globe? It breaks away from the limits of two dimensions without losing any of the logistical convenience—storage and manufacture—of a flat map.
“This is a map you can hold in your hand,” Gott said.
Princeton professors J. Richard Gott and Robert Vanderbei worked with Drexel professor David Goldberg to create a revolutionary new map: a two-sided disk that can slip inside a textbook or be stacked neatly for storage. It provides more accurate distances than any existing flat map, while keeping visual distortions at a minimum. Credit: Video by J. Richard Gott, Robert Vanderbei and David Goldberg
In 2007, Goldberg and Gott invented a system to score existing maps, quantifying the six types of distortions that flat maps can introduce: local shapes, areas, distances, flexion (bending), skewness (lopsidedness) and boundary cuts (continuity gaps). The lower the score, the better: a globe would have a score of 0.0.
[…]
It can be displayed with the Eastern and Western Hemispheres on the two sides, or in Gott’s preferred orientation, the Northern and Southern Hemispheres, which conveniently allows the equator to run around the edge. Either way, this is a map with no boundary cuts. To measure distances from one side to the other, you can use string or measuring tape reaching from one side of the disk to the other, he suggested.
“If you’re an ant, you can crawl from one side of this ‘phonograph record’ to the other,” Gott said. “We have continuity over the equator. African and South America are draped over the edge, like a sheet over a clothesline, but they’re continuous.”
This double-sided map has smaller distance errors than any single-sided flat map—the previous record-holder being a 2007 map by Gott with Charles Mugnolo, a 2005 Princeton alumnus. In fact, this map is remarkable in having an upper boundary on distance errors: It is impossible for distances to be off by more than ± 22.2%. By comparison, in the Mercator and Winkel Tripel projections, as well as others, distance errors become enormous approaching the poles and essentially infinite from the left to the right margins (which are far apart on the map but directly adjacent on the globe). In addition, areas at the edge are only 1.57 times larger than at the center.
Researchers at the University of Maryland have turned ordinary sheets of wood into transparent material that is nearly as clear as glass, but stronger and with better insulating properties. It could become an energy efficient building material in the future.
Wood is made of two basic ingredients: cellulose, which are tiny fibres, and lignin, which bonds those fibres together to give it strength.
Tear a paper towel in half and look closely along the edge. You will see the little cellulose fibres sticking up. Lignin is a glue-like material that bonds the fibres together, a little like the plastic resin in fibreglass or carbon fibre. The lignin also contains molecules called chromophores, which give the wood its brown colour and prevent light from passing through.
Early attempts to make transparent wood involved removing the lignin, but this involved hazardous chemicals, high temperatures and a lot of time, making the product expensive and somewhat brittle. The new technique is so cheap and easy it could literally be done in a backyard.
Starting with planks of wood a metre long and one millimetre thick, the scientists simply brushed on a solution of hydrogen peroxide using an ordinary paint brush. When left in the sun, or under a UV lamp for an hour or so, the peroxide bleached out the brown chromophores but left the lignin intact, so the wood turned white.
Researchers demonstrated after brushing a coat of hydrogen peroxide on the opaque wood material, and exposing it to one hour of sunlight, it turns transparent. (Qinqin Xia, University of Maryland/Science Advances)
Next, they infused the wood with a tough transparent epoxy designed for marine use, which filled in the spaces and pores in the wood and then hardened. This made the white wood transparent.
You can see a similar effect by taking that same piece of paper towel, dip half of it in water and place it on a patterned surface. The white paper towel will become translucent with light passing through the water and cellulose fibres without being scattered by refraction.
The epoxy in the wood does an even better job, allowing 90 per cent of visible light to pass through. The result is a long piece of what looks like glass, with the strength and flexibility of wood.
A researcher holds up a square of transparent wood material against a green leaf. (USDA Forest Service)
As window material, it would be much more resistant to accidental breakage. The clear wood is lighter than glass, with better insulating properties, which is important because windows are a major source of heat loss in buildings. It also might take less energy to manufacture clear wood because there are no high temperatures involved.
Transparent wood could become an alternative to glass in energy efficient buildings, or perhaps coverings for solar panels in harsh environments. There could be no end of uses.
Scientists around the world have noted that the Earth has been spinning on its axis faster lately—the fastest ever recorded. Several scientists have spoken to the press about the unusual phenomenon, with some pointing out that this past year saw some of the shortest days ever recorded.
For most of the history of mankind, time has been marked by the 24-hour day/night cycle (with some alterations made for convenience as the seasons change). The cycle is governed by the speed at which the planet spins on its axis. Because of that, the length of a day has become the standard by which time is marked—each day lasts approximately 86,400 seconds. The day/night cycle is remarkably consistent despite the fact that it actually varies slightly on a regular basis.
Several decades ago, the development of atomic clocks began allowing scientists to record the passage of time in incredibly small increments, in turn, allowing for measuring the length of a given day down to the millisecond. And that has led to the discovery that the spin of the planet is actually far more variable than once thought. Since such measurements began, scientists have also found that the Earth was slowing its spin very gradually (compensated by the insertion of a leap second now and then)—until this past year, when it began spinning faster—so much so that some in the field have begun to wonder if a negative leap negative second might be needed this year, an unprecedented suggestion. Scientists also noted that this past summer, on July 19, the shortest day ever was recorded—it was 1.4602 milliseconds shorter than the standard.
Planetary scientists are not concerned about the new finding; they have learned that there are many factors that have an impact on planetary spin—including the moon’s pull, snowfall levels and mountain erosion. They also have begun wondering if global warming might push the Earth to spin faster as the snow caps and high-altitude snows begin disappearing. Computer scientists, on the other hand, are somewhat concerned about the shifting spin speed—so much of modern technology is based on what they describe as “true time.” Adding a negative leap second could lead to problems, so some have suggested shifting the world’s clocks from solar time to atomic time.
Nothing keeps time like the beating heart of an atom. But even the crisp tick-tock of a vibrating nucleus is limited by uncertainties imposed by the laws of quantum mechanics.
Several years ago, researchers from MIT and the University of Belgrade in Serbia proposed that quantum entanglement could push clocks beyond this blurry boundary.
Now, we have a proof of concept in the form of an experiment. Physicists connected together a cloud of ytterbium-171 atoms with streams of photons reflected from a surrounding hall of mirrors and measured the timing of their tiny wiggles.
Their results show that entangling atoms in this way could speed up the time-measuring process of atomic nuclei clocks, making them more precise than ever. In principle, a clock based on this new approach would lose just 100 milliseconds since the dawn of time itself.
[…]
In this case, the team found entanglement made the measurement process roughly three times faster compared with clocks acting at the SQL.
That might not seem all that dramatic, but a speed boost could be just the thing we need to study some of the more subtle influences the Universe has on time.
“As the Universe ages, does the speed of light change? Does the charge of the electron change?” says lead researcher Vladan Vuletic from MIT.
“That’s what you can probe with more precise atomic clocks.”
Plants have the same variation in body clocks as that found in humans, according to new research that explores the genes governing circadian rhythms in plants.
The research shows a single letter change in their DNA code can potentially decide whether a plant is a lark or a night owl. The findings may help farmers and crop breeders to select plants with clocks that are best suited to their location, helping to boost yield and even the ability to withstand climate change.
[…]
To investigate the genetic basis of these local differences, the team examined varying circadian rhythms in Swedish Arabidopsis plants to identify and validate genes linked to the changing tick of the clock.
Dr. Hannah Rees, a postdoctoral researcher at the Earlham Institute and author of the paper, said: “A plant’s overall health is heavily influenced by how closely its circadian clock is synchronised to the length of each day and the passing of seasons. An accurate body clock can give it an edge over competitors, predators and pathogens.
[..]
The team studied the genes in 191 different varieties of Arabidopsis obtained from across the whole of Sweden. They were looking for tiny differences in genes between these plants which might explain the differences in circadian function.
Their analysis revealed that a single DNA base-pair change in a specific gene—COR28—was more likely to be found in plants that flowered late and had a longer period length. COR28 is a known coordinator of flowering time, freezing tolerance and the circadian clock; all of which may influence local adaptation in Sweden.
“It’s amazing that just one base-pair change within the sequence of a single gene can influence how quickly the clock ticks,” explained Dr. Rees.
The scientists also used a pioneering delayed fluorescence imaging method to screen plants with differently-tuned circadian clocks. They showed there was over 10 hours difference between the clocks of the earliest risers and latest phased plants—akin to the plants working opposite shift patterns. Both geography and the genetic ancestry of the plant appeared to have an influence.
The shift to online science communication from conventional news platforms has been going on for a while. There is a need for credible and accurate science reporting because the miscommunication of science in the media is causing lasting damage to the public’s understanding of science.
Misinformation has consequences, as seen during the ongoing COVID-19 pandemic. Ignoring public health advice to wear masks and physically distance has cost thousands of lives and livelihoods in countries such as the United States, Brazil and Russia. Yet, resources in science journalism are dwindling. Budget cuts have slashed the number of journalists in conventional news outlets; this often affects specialized reporters like science journalists.
We need to equip scientists with science journalism skills. At Concordia University,
[…]
This withdrawal of conventional news outlets from conducting science journalism and the increasing role of universities and scientists doing so introduce new challenges.
[…]
Because there are fewer science journalists in conventional news outlets, the public is less able to access the scientific information they need to make informed decisions. This is further exacerbated by the flaws of the existing academic publishing model.
Currently, scientists communicate their research via private publishing groups. Due to paywalls, this research is very hard to access by the taxpayers who fund that research. Meanwhile, research funded by industry is freely accessible to the public via the publication of patents
When it comes to communicating research, there is an inherent conflict of interest between scientists and the universities that employ them.
That’s not to say that universities have sinister intentions. Universities are heavily invested in enhancing their reputations, which is closely tied to their success in raising funds through student recruitment, government grants and philanthropic endowments.
Universities view science communication as a fundraising activity, directed at funding sources, rather than the general public.
[…]
Universities should equip scientists with the knowledge-translation skills necessary to communicate their own science critically and credibly
[…]
Universities should also find a way to engage students in scientific communication. For example, there should be funding for internships for communications students, where those hired can manage Twitter accounts and blogs for research labs, update websites and write research publications in a more compelling, accessible and critical way
While traditional diamonds are formed over billions of years deep in the Earth where extreme pressures and temperatures provide just the right conditions to crystalize carbon, scientists are working on more expedient ways of forging the precious stones. An international team of researchers has succeeded in whittling this process down to mere minutes, demonstrating a new technique where they not only form quickly, but do so at room temperature.
This latest breakthrough was led by scientists at the Australian National University (ANU) and RMIT University, who used what’s known as a diamond anvil cell, which is a device used by researchers to generate the extreme pressures needed to create ultra-hard materials. The team applied pressure equal to 640 African elephants on the tip of a ballet shoe, doing so in a way that caused an unexpected reaction among the the carbon atoms in the device. “The twist in the story is how we apply the pressure,” says ANU Professor Jodie Bradby. “As well as very high pressures, we allow the carbon to also experience something called ‘shear’ — which is like a twisting or sliding force. We think this allows the carbon atoms to move into place and form Lonsdaleite and regular diamond.”
These regular diamonds are the type you might find in an engagement ring, while Lonsdaleite diamonds are rarer and found at meteorite impact sites. Using advanced electron microscopy, the team was able to examine the samples in detail, and found that the materials were formed within bands they liken to “rivers” of diamond. The team hopes the technique can enable them to produce meaningful quantities of these artificial diamonds, particularly Lonsdaleite, which is predicted to be 58 percent harder than regular diamonds. “Lonsdaleite has the potential to be used for cutting through ultra-solid materials on mining sites,” Bradby says. The research was published in the journal Small, while you can hear from the researchers in this video.
Airglow is the natural “glowing” of the Earth’s atmosphere. It happens all the time and across the whole globe. There are three types of airglow: dayglow, twilightglow and nightglow. Each is the result of sunlight interacting with the molecules in our atmosphere, but they have their own special way of forming.
Dayglow forms when sunlight strikes the daytime atmosphere. Some of the sunlight is absorbed by the molecules in the atmosphere, which gives them excess energy. They become excited. The molecules then release this energy as light, either at the same or slightly lower frequency (colour) as the light they absorbed. This light is much dimmer than daylight, so we can’t see it by eye.
Twilight glow is essentially the same as dayglow, but only the upper atmosphere is sunlit. The rest of the atmosphere and the observer on the ground are in darkness. So, unlike day glow, twilightglow is actually visible to us on the ground with the naked eye.
Chemiluminescence
The chemistry behind nightglow is different. There is no sunlight shining on the nighttime atmosphere. Instead, a process called “chemiluminescence” is responsible for the glowing atmosphere.
Sunlight deposits energy into the atmosphere during the day, some of which is transferred to oxygen molecules (e.g. O₂). This extra energy causes the oxygen molecules to rip apart into individual oxygen atoms. This happens particularly around 100km in altitude. However, atomic oxygen isn’t able to get rid of this excess energy easily and so acts as a “store” of energy for several hours.
Eventually the atomic oxygen does manage to “recombine”, once again forming molecular oxygen. The molecular oxygen then releases energy, again in the form of light. Several different colours are produced, including a “bright” green emission.
Airglow spotted in panoramic shot of the Very Large Telescope. Beletsky, CC BY-SA
In reality, the green nightglow isn’t particularly bright, it’s just the brightest of all nightglow emissions. Light pollution and cloudy skies will prevent sightings. If you’re lucky though, you might just be able to see it by eye or capture it on long-exposure photos.
Not to be confused with aurora
The green night glow emission is very similar to the famous green we see in the northern lights. This is unsurprising since it is produced by the same oxygen molecules as the green aurora. But the two phenomena are not related.
Aurora form when charged particles, such as electrons, bombard the Earth’s atmosphere. These charged particles, which started off at the sun and were accelerated in the Earth’s magnetosphere, collide with the atmospheric gases. They transfer energy, forcing the gases to emit light.
The aurora and airglow captured from the International Space Station.NASA
But it isn’t just the process behind them that is different. The aurora form in a ring around the magnetic poles (known as the auroral oval); whereas nightglow is emitted across the whole night sky. The aurora are very structured (due to the Earth’s magnetic field); whereas airglow is generally quite uniform. The extent of the aurora is affected by the strength of the solar wind; whereas airglow happens all the time.
Why then did we get a lot sightings from the UK recently, rather than all the time? The brightness of airglow correlates with the level of ultraviolet (UV) light being emitted from the sun – which varies over time. The time of year also seems to have an impact on the strength of airglow.
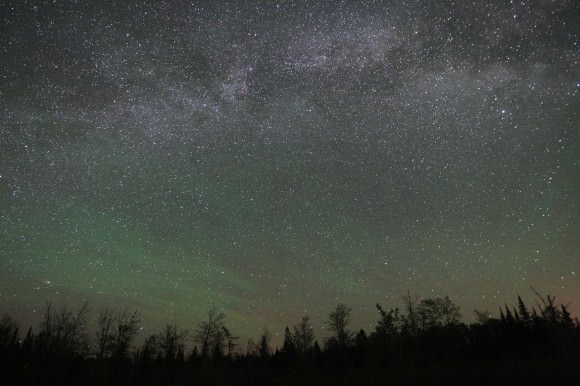
Airglow captured by Michael Darby from Cornwall, UK. The Milky Way shines through in the centre of the image. Author provided
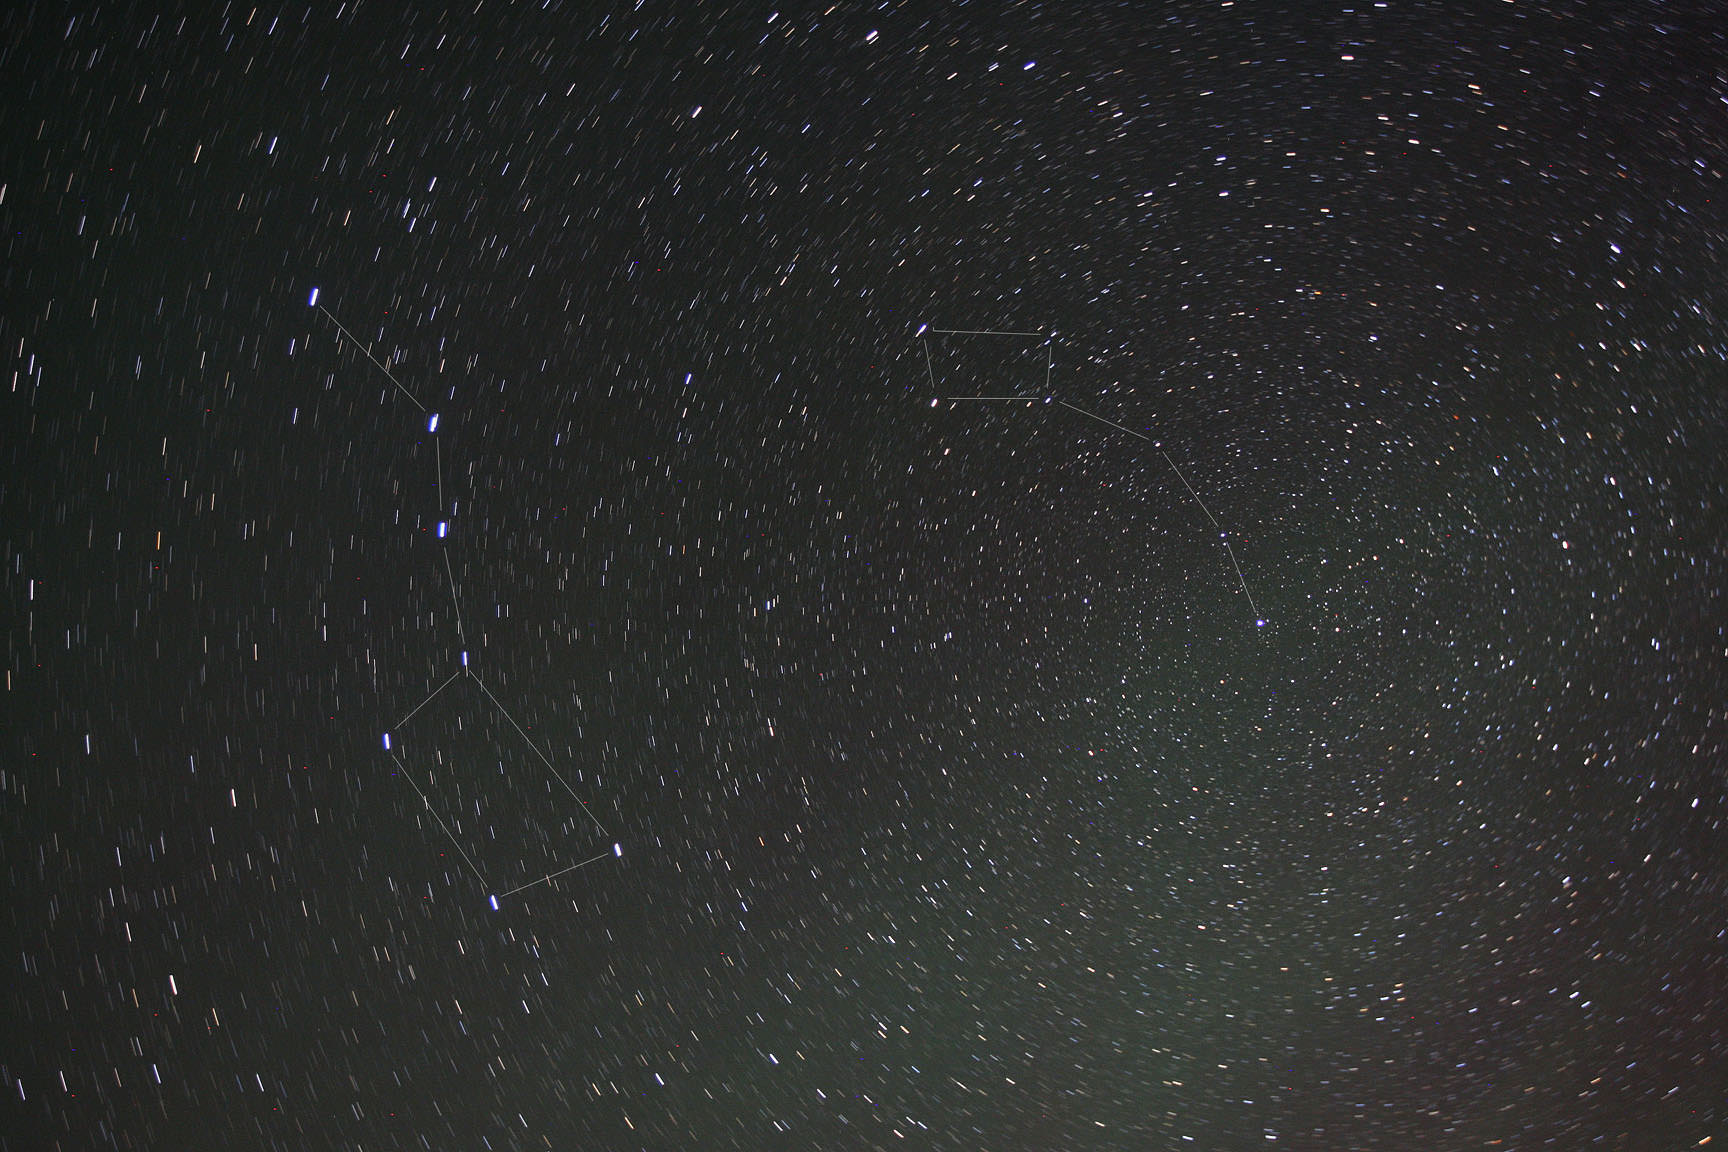
To maximise your chances of spotting airglow, you’ll want to take a long-exposure photograph of a clear, dark, night sky. Airglow can be spotted in any direction that is free of light pollution, at about 10⁰-20⁰ above the horizon.
Emerald green, fainter than the zodiacal light and visible on dark nights everywhere on Earth, airglow pervades the night sky from equator to pole. Airglow turns up in our time exposure photographs of the night sky as ghostly ripples of aurora-like light about 10-15 degrees above the horizon. Its similarity to the aurora is no coincidence. Both form at around the same altitude of 60-65 miles (100 km) and involve excitation of atoms and molecules, in particular oxygen. But different mechanisms tease them to glow.
Earth at night from the International Space Station showing bright splashes of city lights and the airglow layer created by light-emitting oxygen atoms some 60 miles high in the atmosphere. This green cocoon of light is familiar to anyone who’s looked at photos of Earth’s night-side from orbit. Credit: NASA
Auroras get their spark from high-speed electrons and protons in the solar wind that bombard oxygen and nitrogen atoms and molecules. As excited electrons within those atoms return to their rest states, they emit photons of green and red light that create shimmering, colorful curtains of northern lights.
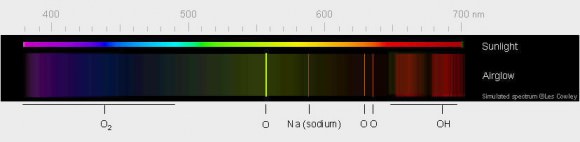
Green light from excited oxygen atoms dominates the light of airglow. The atoms are 56-62 miles high in the thermosphere. The weaker red light is from oxygen atoms further up. Sodium atoms, hydroxyl radicals (OH) and molecular oxygen add their own complement to the light. Credit: Les Cowley
Airglow’s subtle radiance arises from excitation of a different kind. Ultraviolet light from the daytime sun ionizes or knocks electrons off of oxygen and nitrogen atoms and molecules; at night the electrons recombine with their host atoms, releasing energy as light of different colors including green, red, yellow and blue. The brightest emission, the one responsible for creating the green streaks and bands visible from the ground and orbit, stems from excited oxygen atoms beaming light at 557.7 nanometers, smack in the middle of the yellow-green parcel of spectrum where our eyes are most sensitive.
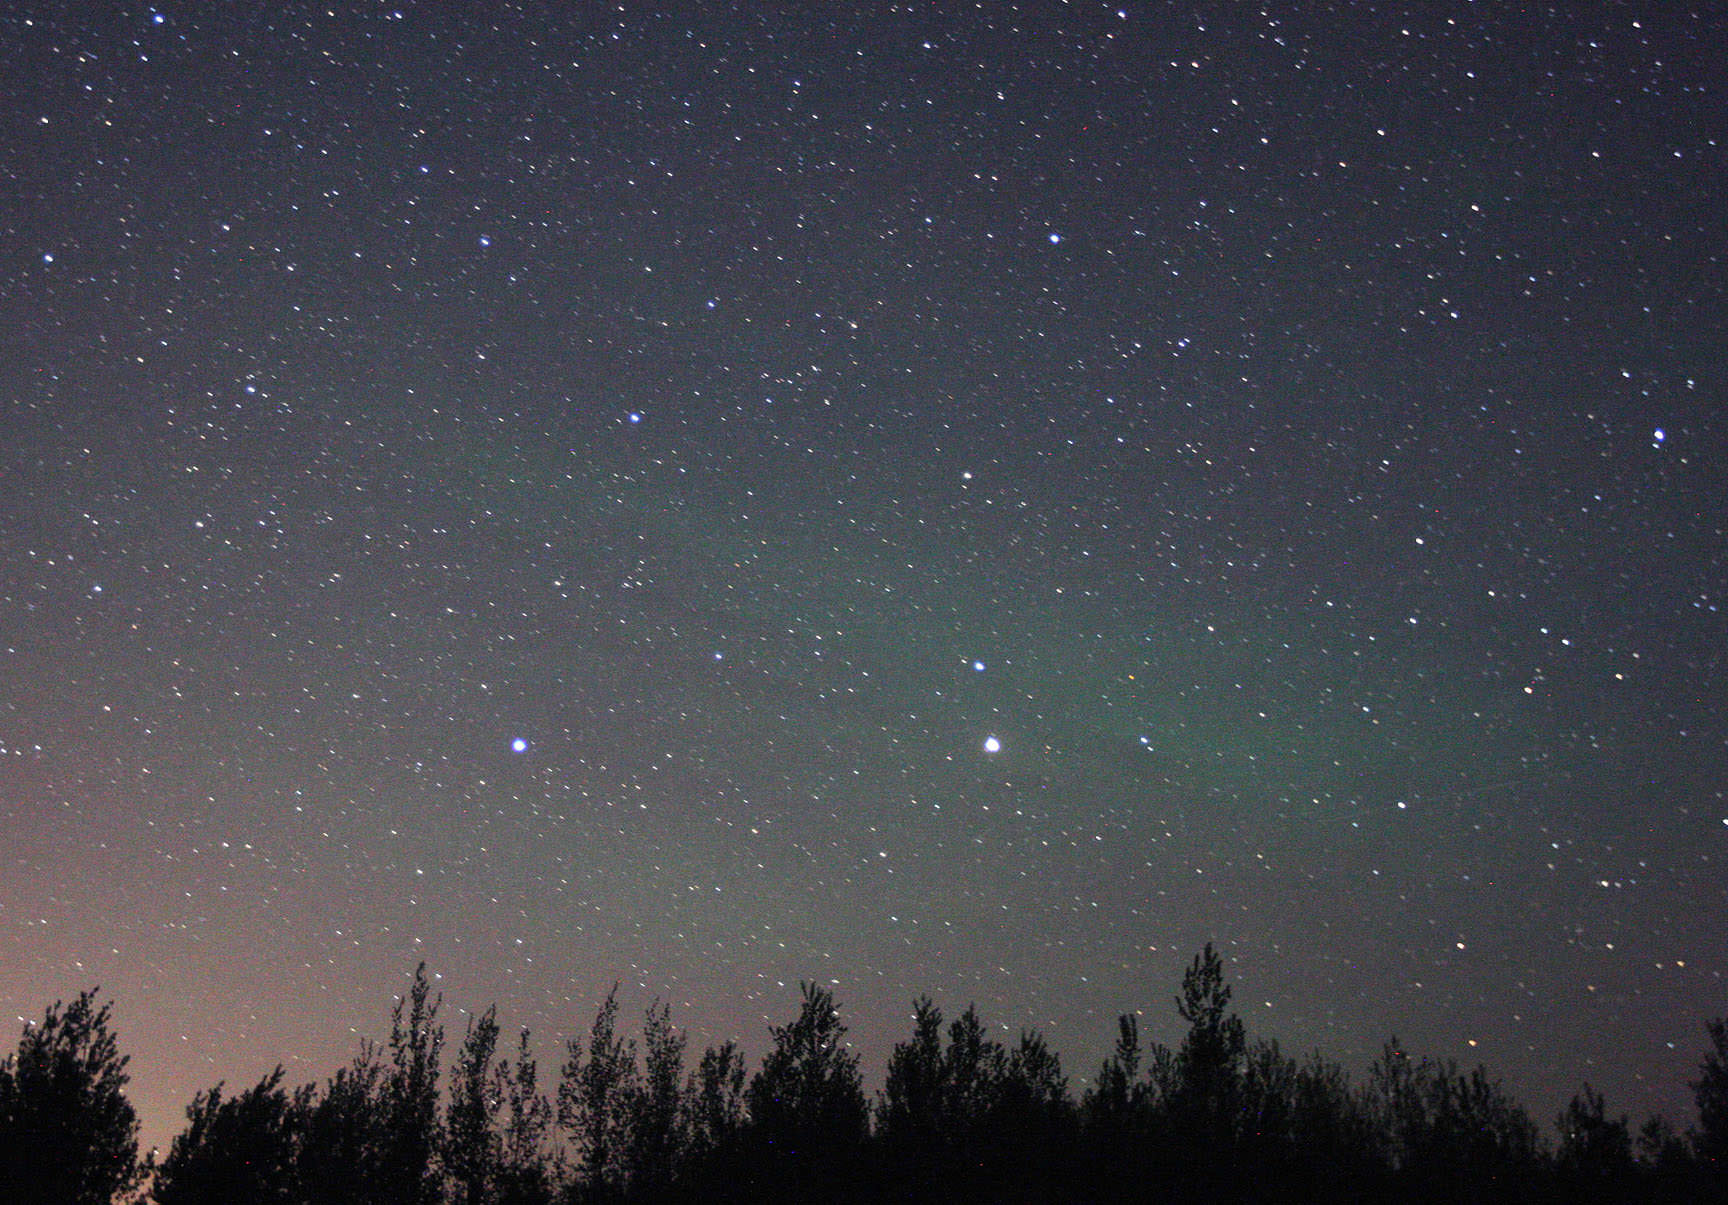
Airglow across the eastern sky below the summertime Milky Way. Notice that unlike the vertical rays and gently curving arcs of the aurora, airglow is banded, streaky and in places almost fibrous. It’s brightest and best visible 10-15 degrees high along a line of sight through the thicker atmosphere. If you look lower, its feeble light is absorbed by denser air and dust. Looking higher, the light spreads out over a greater area and appears dimmer. Credit: Bob KingA large, faint patch of airglow below the Dippers photographed May 24. To the eye, airglow appears as colorless streaks and patches. Unlike the aurora, it’s typically too faint to excite our color vision. Time exposures show its colors well. This swatch is especially faint because it’s much higher above the horizon. Credit: Bob King
That’s not saying airglow is easy to see! For years I suspected streaks of what I thought were high clouds from my dark sky observing site even when maps and forecasts indicated pristine skies. Photography finally taught me to trust my eyes. I started noticing green streaks near the horizon in long-exposure astrophotos. At first I brushed it off as camera noise. Then I noticed how the ghostly stuff would slowly shape-shift over minutes and hours and from night to night. Gravity waves created by jet stream shear, wind flowing over mountain ranges and even thunderstorms in the lower atmosphere propagate up to the thermosphere to fashion airglow’s ever-changing contours.
An obvious airglow smear across Virgo last month. Mars is the bright object below and right of center. Light pollution from Duluth, Minn. creeps in at lower left. Credit: Bob King
Last month, on a particularly dark night, I made a dedicated sweep of the sky after my eyes had fully adapted to the darkness. A large swath of airglow spread south of the Big and Little Dipper. To the east, Pegasus and Andromeda harbored hazy spots of varying intensity, while brilliant Mars beamed through a long smear in Virgo.
To prove what I saw was real, I made the photos you see in this article and found they exactly matched my visual sightings. Except for color. Airglow is typically too faint to fire up the cone cells in our retinas responsible for color vision. The vague streaks and patches were best seen by moving your head around to pick out the contrast between them and the darker, airglow-free sky. No matter what part of the sky I looked, airglow poked its tenuous head. Indeed, if you were to travel anywhere on Earth, airglow would be your constant companion on dark nights, unlike the aurora which keeps to the polar regions. Warning – once you start seeing it, you
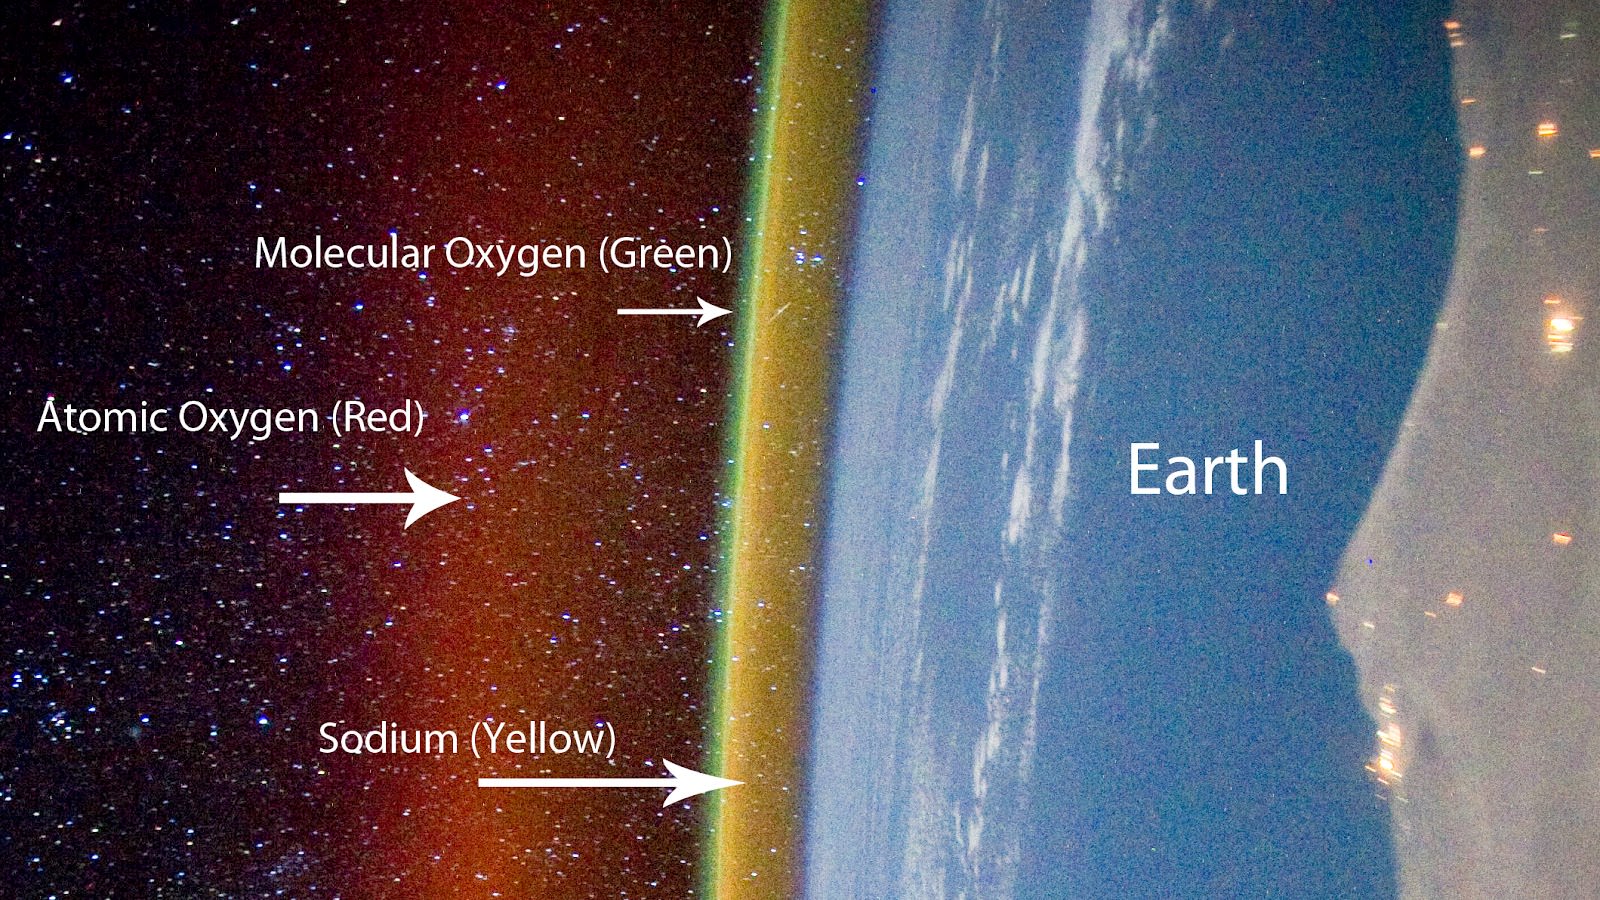
Excited oxygen at higher altitude creates a layer of faint red airglow. Sodium excitation forms the yellow layer at 57 miles up. Airglow is brightest during daylight hours but invisible against the sunlight sky. Credit: NASA with annotations by Alex Rivest
Airglow comes in different colors – let’s take a closer look at what causes them:
* Red – I’ve never seen it, but long-exposure photos often reveal red/pink mingled with the more common green. Excited oxygen atoms much higher up at 90-185 miles (150-300 km) radiating light at a different energy state are responsible. Excited -OH (hydroxyl) radicals give off deep red light in a process called chemoluminescencewhen they react with oxygen and nitrogen. Another chemoluminescent reaction takes place when oxygen and nitrogen molecules are busted apart by ultraviolet light high in the atmosphere and recombine to form nitric oxide (NO).
* Yellow – From sodium atoms around 57 miles (92 km) high. Sodium arrives from the breakup and vaporization of minerals in meteoroids as they burn up in the atmosphere as meteors.
* Blue – Weak emission from excited oxygen molecules approximately 59 miles (95 km) high.
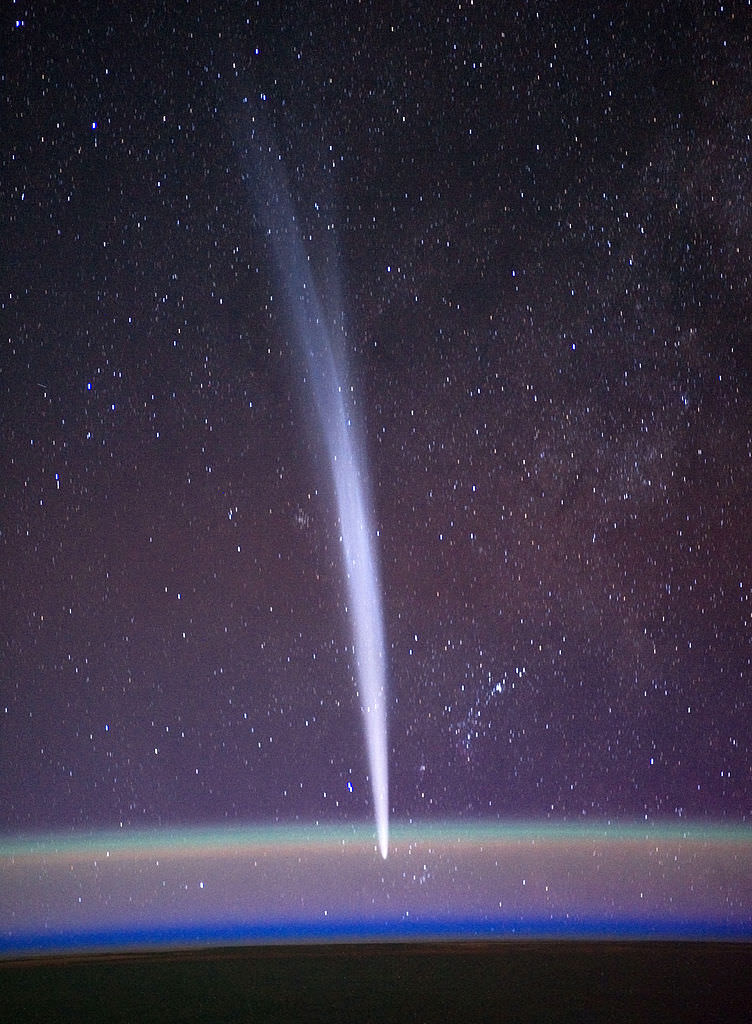
Comet Lovejoy passing behind green oxygen and sodium airglow layers on December 22, 2011 seen from the space station. Credit: NASA/Dan Burbank
Airglow varies time of day and night and season, reaching peak brightness about 10 degrees, where our line of sight passes through more air compared to the zenith where the light reaches minimum brightness. Since airglow is brightest around the time of solar maximum (about now), now is an ideal time to watch for it. Even cosmic rays striking molecules in the upper atmosphere make a contribution.
https://www.youtube.com/embed/zymQQP4B21Q See lots of airglow and aurora from orbit in this video made using images taken from the space station.
If you removed the stars, the band of the Milky Way and the zodiacal light, airglow would still provide enough illumination to see your hand in front of your face at night. Through recombination and chemoluminescence, atoms and molecules creates an astounding array of colored light phenomena. We can’t escape the sun even on the darkest of nights.
In 2018, a new aurora-like discovery struck the world. From 2015 to 2016, citizen scientists reported 30 instances of a purple ribbon in the sky, with a green picket fence structure underneath. Now named STEVE, or Strong Thermal Emission Velocity Enhancement, this phenomenon is still new to scientists, who are working to understand all its details. What they do know is that STEVE is not a normal aurora—some think maybe it’s not an aurora at all—and a new finding about the formation of streaks within the structure brings scientists one step closer to solving the mystery.
“Often in physics, we build our understanding then test the extreme cases or test the cases in a different environment,” Elizabeth MacDonald, a space scientist at NASA’s Goddard Space Flight Center in Greenbelt, Maryland, explains. “STEVE is different than the usual aurora, but it is made of light and it is driven by the auroral system. In finding these tiny little streaks, we may be learning something fundamentally new in how green auroral light can be produced.”
These “tiny little streaks” are extraordinarily small point-like features within the green picket fence of STEVE. In a new paper for AGU Advances, researchers share their latest findings on these points. They suggest the streaks could be moving points of light—elongated in the images due to blur from the cameras. The tip of the streak in one image will line up with the end of the tail in the next image, contributing to this speculation from the scientists. However, there are still a lot of questions to be answered—determining whether the green light is a point or indeed a line, is one extra clue to help scientists figure out what causes green light.
“I’m not entirely sure about anything with respect to this phenomenon just yet,” Joshua Semeter, a professor at Boston University and first author on the paper, said. “You have other sequences where it looks like there is a tube-shaped structure that persists from image to image and doesn’t seem to conform to a moving point source, so we’re not really sure about that yet.”
STEVE as a whole is something that scientists are still working to label. Scientists tend to classify optical features in the sky into two categories: airglow and aurora. When airglow occurs at night, atoms in the atmosphere recombine and release some of their stored energy in the form of light, creating bright swaths of color. By studying the patterns in airglow, scientists can learn more about that area of the atmosphere, the ionosphere. To be classified as an aurora, on the other hand, that release of light must be caused by electron bombardment. These features are formed differently but also look different—airglow can occur across Earth, while auroras form in a broad ring around Earth’s magnetic poles.
“STEVE in general appears to not conform well to either one of those categories,” Semeter said. “The emissions are coming from mechanisms that we don’t fully understand just yet.”
STEVE’s purple emissions are likely a result of ions moving at a supersonic speed. The green emissions seem to be related to eddies, like the ones you might see forming in a river, moving more slowly than the other water around it. The green features are also moving more slowly than the structures in the purple emissions, and scientists speculate they could be caused by turbulence in the space particles—a brew of charged particles and magnetic field, called plasma—at these altitudes.
“We know this kind of turbulence occurs. There are people who base their entire careers on studying turbulence in the ionospheric plasma formed by very rapid flows.” Semeter said. “The evidence generally comes from radar measurements. We don’t ever have an optical signature.” Semeter suggests that when it comes to the appearance of STEVE, the flows in these instances are so extreme, that we can actually see them in the atmosphere. Two different angles of distinctive green streaks below a STEVE event on Aug. 31, 2016, near Carstairs, Alberta, Canada. Recent research about the formation of these streaks is allowing scientists to learn more about this aurora-like phenomenon. Credit: Copyright Neil Zeller, used with permission
“This paper is the tip of the iceberg in this new area of these tiny little pieces of the picket fence. Something we do in physics is try to chip away to increase our understanding,” MacDonald said. “This paper establishes the altitude range and some of the techniques we can use to identify these features, then they can be better resolved in other observations.”
To establish the altitude range and identify these features, the scientists extensively used photos and videos captured by citizen scientists.
“Citizen scientists are the ones who brought the STEVE phenomenon to the scientists’ attention. Their photos are typically longer time lapse than our traditional scientific observations,” MacDonald said. “Citizen scientists don’t get into the patterns that scientists get into. They do things differently. They are free to move the camera around and take whatever exposure they want.” However, to make this new discovery of the points within STEVE, photographers actually took shorter exposure photographs to capture this movement.
To get those photographs, citizen scientists spend hours in the freezing cold, late at night, waiting for an aurora—or hopefully STEVE—to appear. While data can indicate if an aurora will show up, indicators for STEVE haven’t been identified yet. However, the aurora chasers show up and take pictures anyway.
Many hopes for a return to a semi-normal life after COVID-19 revolve around vaccines, but those injections have limits — they’re harder to deploy in low-income and rural areas where there’s no guarantee of easy distribution. Science may offer a more accessible alternative, though. Columbia University researchers have developed a nasal spray that has successfully prevented COVID-19 infections in tests with ferrets as well as a 3D model of human lungs.
The lipopeptide (that is, a lipid and peptide combination) prevents the coronavirus from fusing with a target cell’s membrane by blocking a key protein from adopting a necessary shape. It should work immediately and last for at least 24 hours. It’s also affordable, lasts a long time, and doesn’t need refrigeration.
A spray like this is still some ways from reaching the public. There would need to be human clinical trials, not to mention large-scale production to provide enough access. Scientists are planning to “rapidly advance” to further testing, Columbia said.
The move could bring protection to many parts of the world where mass COVID-19 vaccinations would be difficult. It might also serve as a “complement” even in places where vaccines are readily available, key researchers Anne Moscona and Matteo Porotto said. People who can’t take vaccines, or those for whom vaccinations don’t work, could spray themselves daily knowing they’d be safe. That, in turn, could further limit the spread of the virus and hasten the end to the pandemic.
Scientists have found evidence that frozen methane deposits in the Arctic Ocean – known as the “sleeping giants of the carbon cycle” – have started to be released over a large area of the continental slope off the East Siberian coast, the Guardian can reveal.
High levels of the potent greenhouse gas have been detected down to a depth of 350 metres in the Laptev Sea near Russia, prompting concern among researchers that a new climate feedback loop may have been triggered that could accelerate the pace of global heating.
The slope sediments in the Arctic contain a huge quantity of frozen methane and other gases – known as hydrates. Methane has a warming effect 80 times stronger than carbon dioxide over 20 years. The United States Geological Survey has previously listed Arctic hydrate destabilisation as one of four most serious scenarios for abrupt climate change.
The international team onboard the Russian research ship R/V Akademik Keldysh said most of the bubbles were currently dissolving in the water but methane levels at the surface were four to eight times what would normally be expected and this was venting into the atmosphere.
“At this moment, there is unlikely to be any major impact on global warming, but the point is that this process has now been triggered. This East Siberian slope methane hydrate system has been perturbed and the process will be ongoing,” said the Swedish scientist Örjan Gustafsson, of Stockholm University, in a satellite call from the vessel.
MIT researchers have now found that people who are asymptomatic may differ from healthy individuals in the way that they cough. These differences are not decipherable to the human ear. But it turns out that they can be picked up by artificial intelligence.
In a paper published recently in the IEEE Journal of Engineering in Medicine and Biology, the team reports on an AI model that distinguishes asymptomatic people from healthy individuals through forced-cough recordings, which people voluntarily submitted through web browsers and devices such as cellphones and laptops.
The researchers trained the model on tens of thousands of samples of coughs, as well as spoken words. When they fed the model new cough recordings, it accurately identified 98.5 percent of coughs from people who were confirmed to have Covid-19, including 100 percent of coughs from asymptomatics — who reported they did not have symptoms but had tested positive for the virus.
The team is working on incorporating the model into a user-friendly app, which if FDA-approved and adopted on a large scale could potentially be a free, convenient, noninvasive prescreening tool to identify people who are likely to be asymptomatic for Covid-19. A user could log in daily, cough into their phone, and instantly get information on whether they might be infected and therefore should confirm with a formal test.
“The effective implementation of this group diagnostic tool could diminish the spread of the pandemic if everyone uses it before going to a classroom, a factory, or a restaurant,” says co-author Brian Subirana, a research scientist in MIT’s Auto-ID Laboratory.
Subirana’s co-authors are Jordi Laguarta and Ferran Hueto, of MIT’s Auto-ID Laboratory.
Prior to the pandemic’s onset, research groups already had been training algorithms on cellphone recordings of coughs to accurately diagnose conditions such as pneumonia and asthma. In similar fashion, the MIT team was developing AI models to analyze forced-cough recordings to see if they could detect signs of Alzheimer’s, a disease associated with not only memory decline but also neuromuscular degradation such as weakened vocal cords.
They first trained a general machine-learning algorithm, or neural network, known as ResNet50, to discriminate sounds associated with different degrees of vocal cord strength. Studies have shown that the quality of the sound “mmmm” can be an indication of how weak or strong a person’s vocal cords are. Subirana trained the neural network on an audiobook dataset with more than 1,000 hours of speech, to pick out the word “them” from other words like “the” and “then.”
The team trained a second neural network to distinguish emotional states evident in speech, because Alzheimer’s patients — and people with neurological decline more generally — have been shown to display certain sentiments such as frustration, or having a flat affect, more frequently than they express happiness or calm. The researchers developed a sentiment speech classifier model by training it on a large dataset of actors intonating emotional states, such as neutral, calm, happy, and sad.
The researchers then trained a third neural network on a database of coughs in order to discern changes in lung and respiratory performance.
Finally, the team combined all three models, and overlaid an algorithm to detect muscular degradation. The algorithm does so by essentially simulating an audio mask, or layer of noise, and distinguishing strong coughs — those that can be heard over the noise — over weaker ones.
With their new AI framework, the team fed in audio recordings, including of Alzheimer’s patients, and found it could identify the Alzheimer’s samples better than existing models. The results showed that, together, vocal cord strength, sentiment, lung and respiratory performance, and muscular degradation were effective biomarkers for diagnosing the disease.
[…]
Surprisingly, as the researchers write in their paper, their efforts have revealed “a striking similarity between Alzheimer’s and Covid discrimination.”